

Why Young Workers Are 2.5 Times More Likely to Be Unemployed
Youth unemployment is structurally different from prime-age unemployment.


Youth unemployment is back in the headlines. Recent coverage often attributes young workers’ struggles to AI, return-to-office policies, corporate cost-cutting, or other contemporary forces. Before looking for new explanations, it’s worth asking a basic question: Is youth unemployment unusually high?
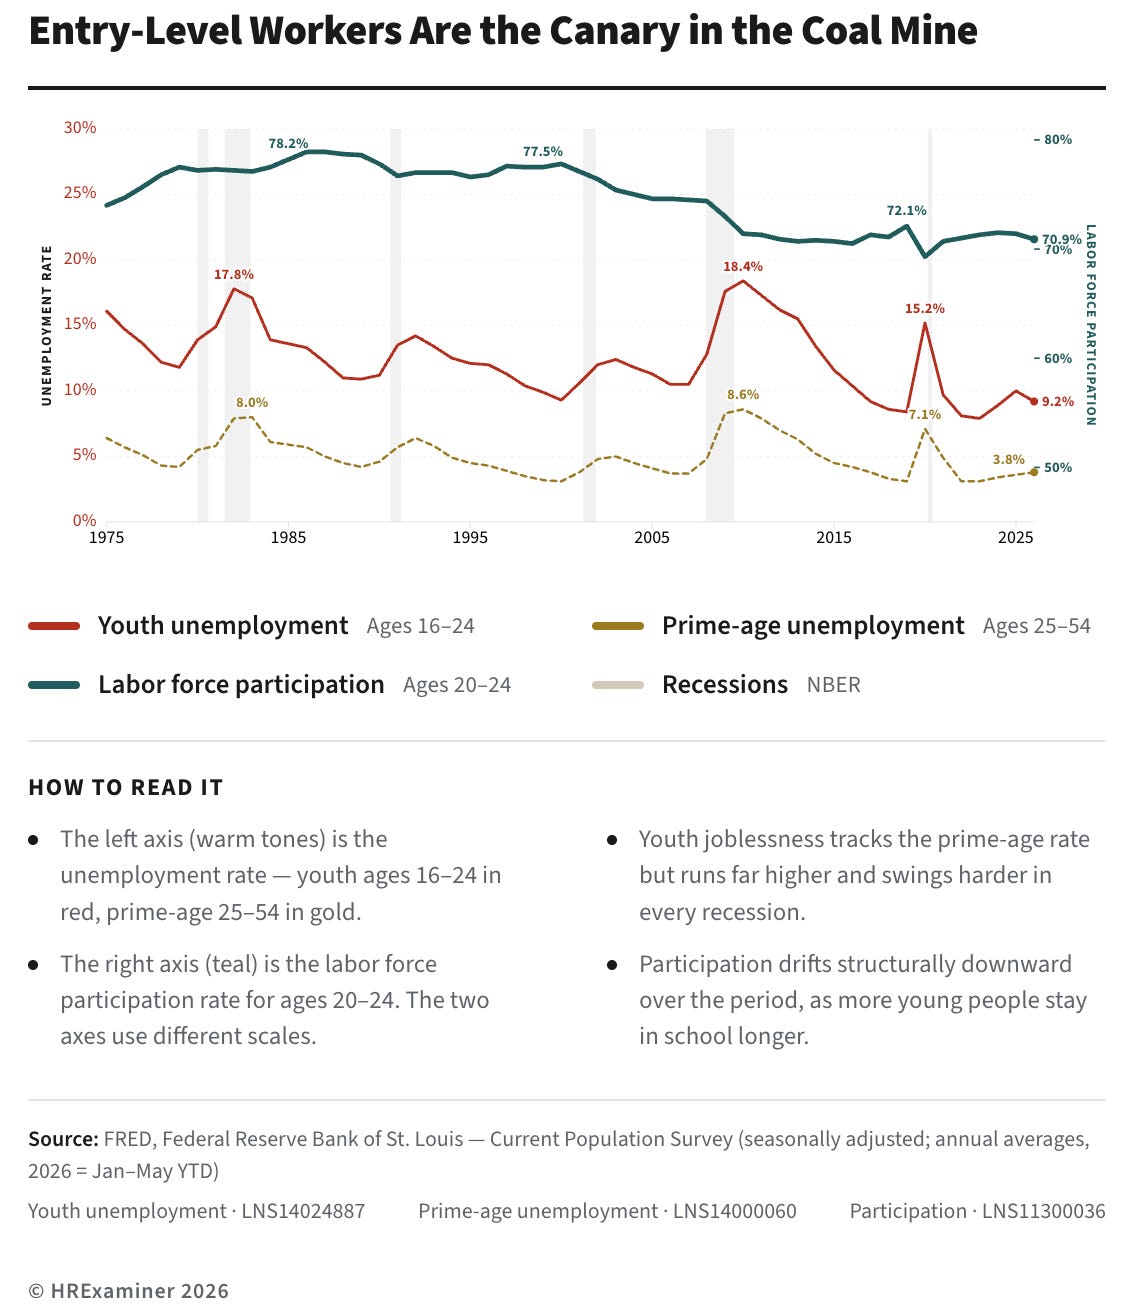
Today’s entry-level rate is roughly half of what it was when I entered the workforce in 1978 (17.8%). The unemployment rate for people between 25 and 54 (Prime-age unemployment) was about 8%. That gap persists over time. The entry level unemployment rate is always 2 to 2.5 times the Prime age rate.
The difference is structural and remarkably persistent across economic cycles.
Throughout this article, “entry-level” refers to workers ages 16-24, the age group most likely to be entering the labor market for the first time. It just takes longer for young people to find their place in the workforce. Today’s entry level unemployment rate is near an historic low. It’s actually falling slightly. So, what’s the fuss about?
In the following chart, it’s clear that the entry level unemployment rate starts to spike in advance of a recession (the grey vertical bars). Historically, youth unemployment often begins rising before recessions become visible in broader labor-market data. Entry level jobs are always hit harder and earlier.
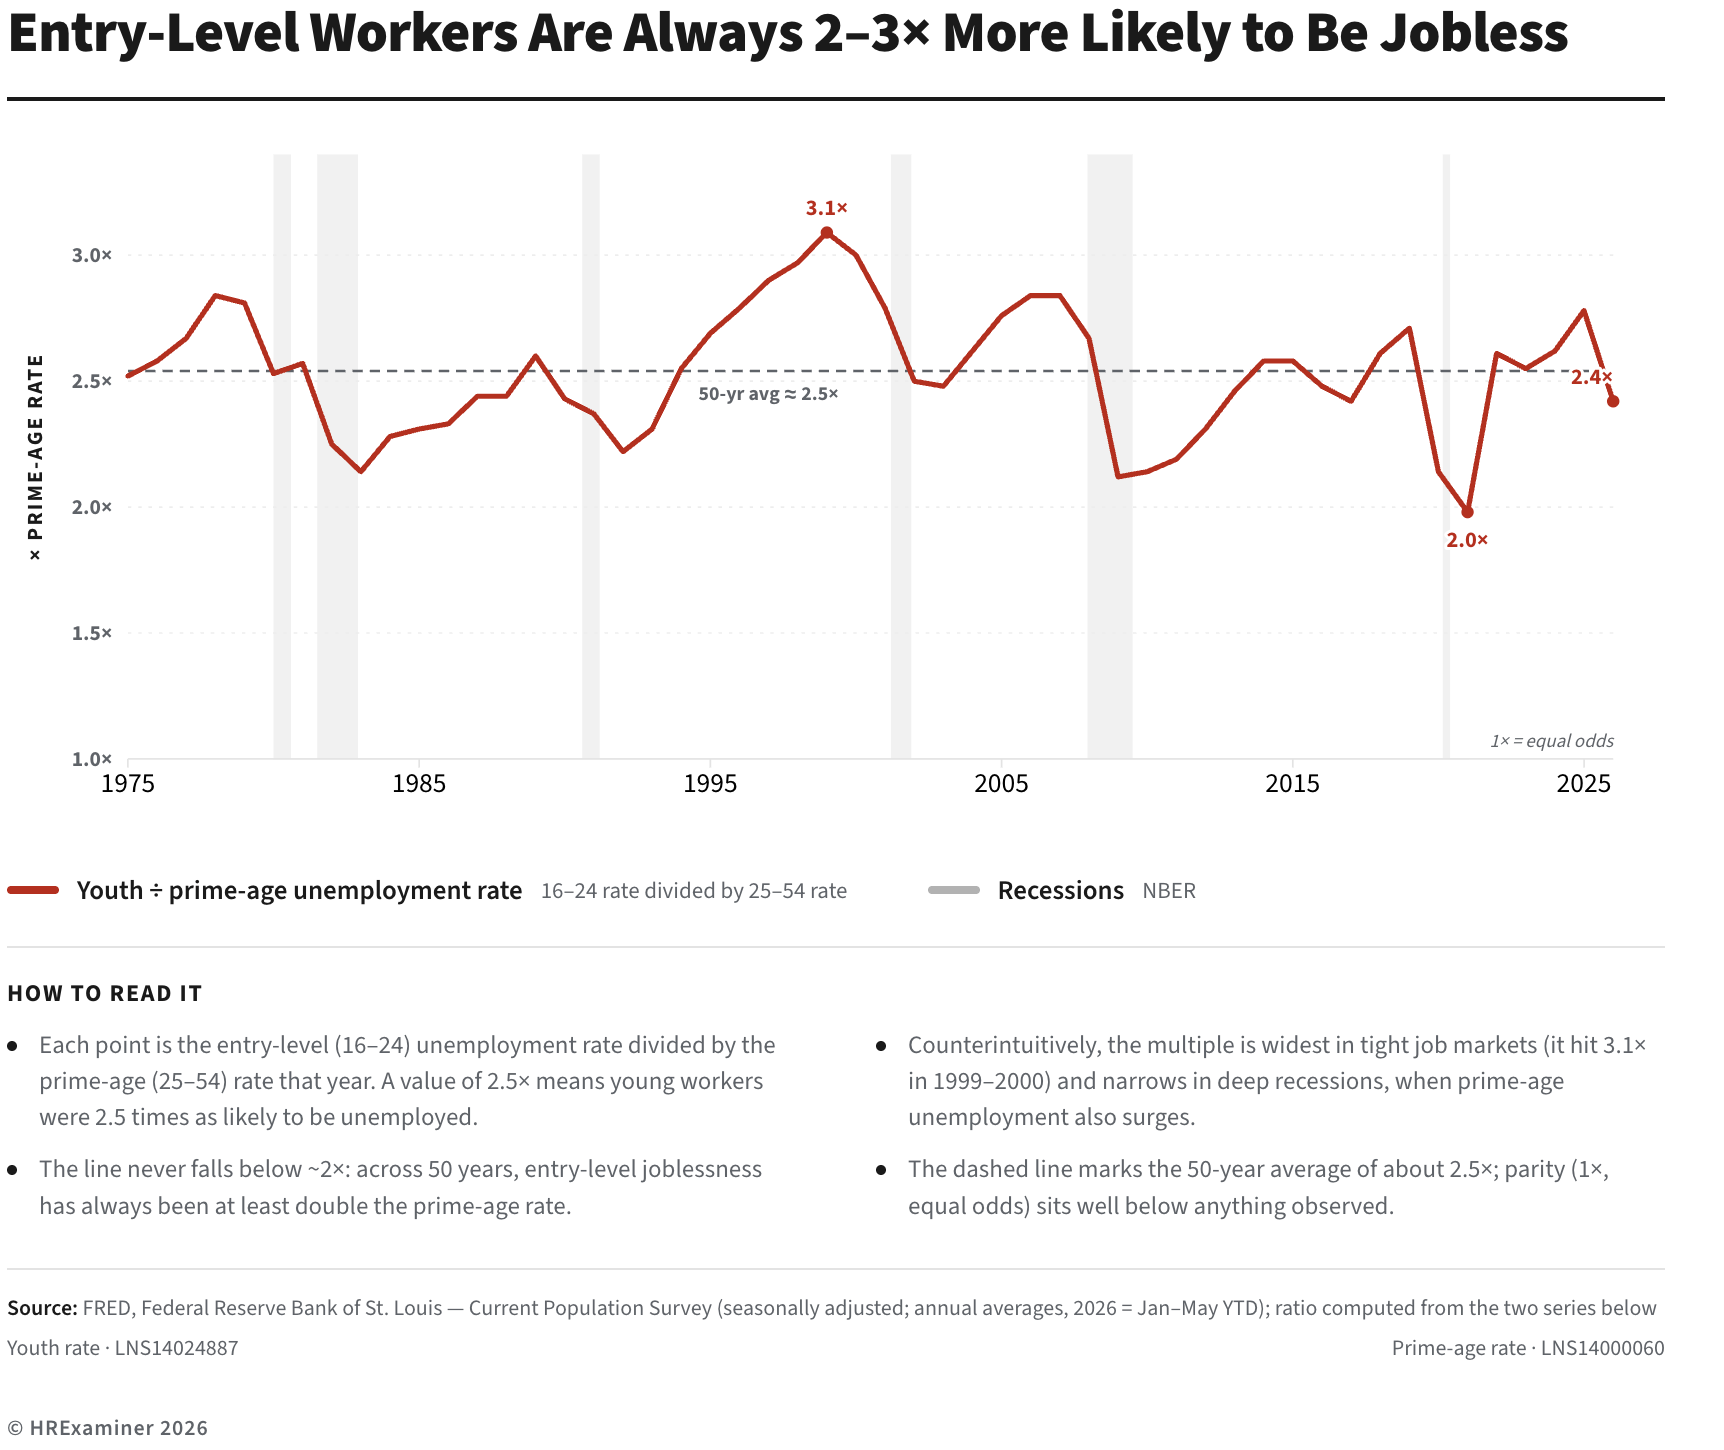
Over the past 50 years, the entry-level unemployment rate has averaged 2.5 times the prime-age level. The most striking feature of the data is not the unemployment rate itself. It’s the relationship between youth and prime-age unemployment. For half a century, young workers have been roughly 2 to 3 times more likely to be unemployed than workers in their prime earning years.
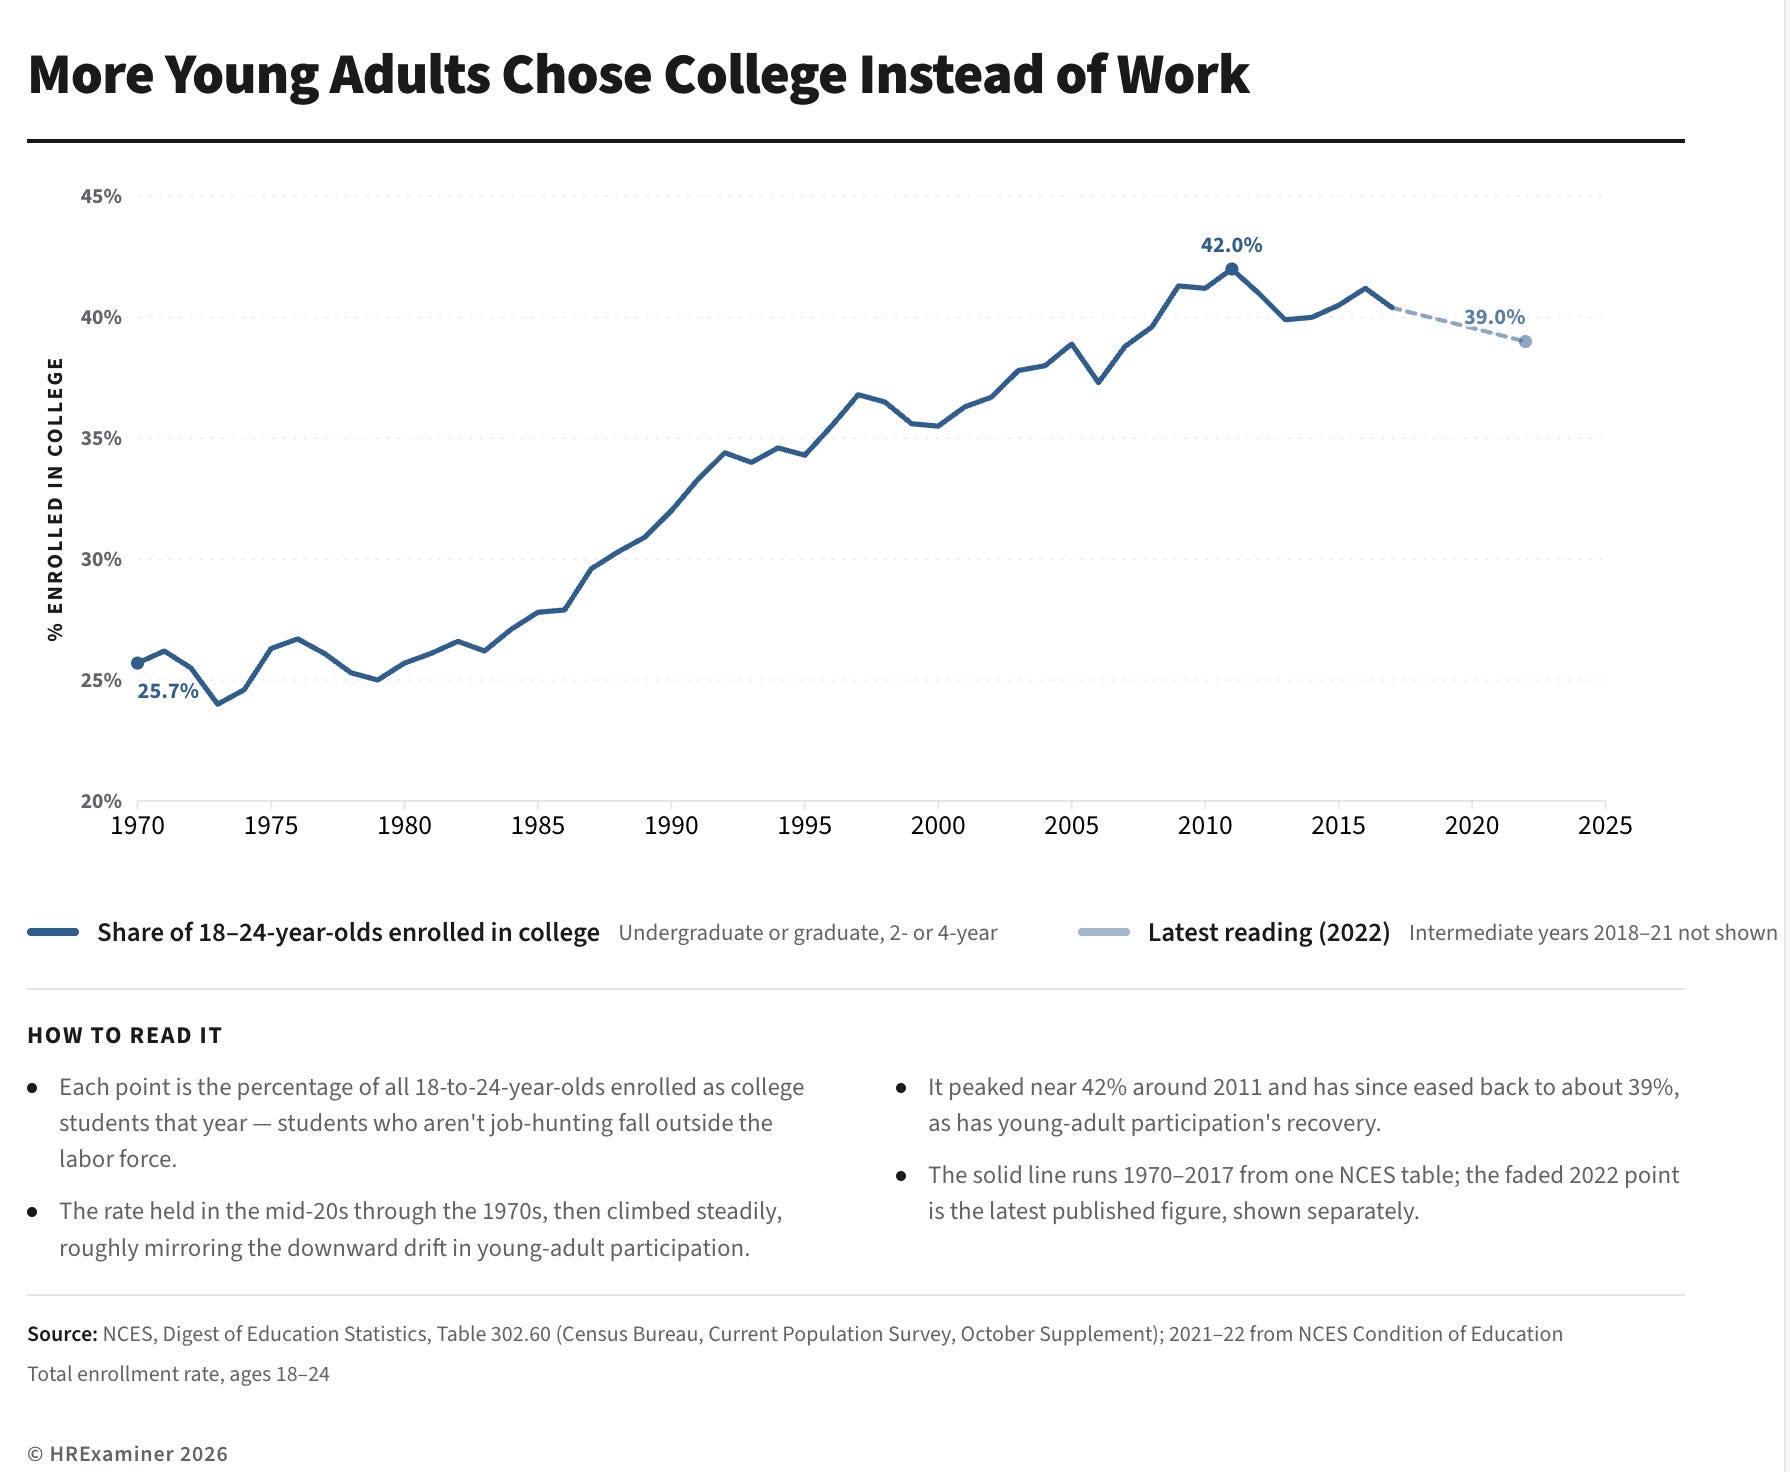
If young people are supposedly unable to find work, we would expect them to be actively searching. Participation data suggest something different. The reason that the entry-level participation rate declined is a marked increase in college enrollment. Over the 50 years in the chart, the percentage of entry-level aged people who are enrolled in college nearly doubled! College attendance reduces labor-force participation because students are less likely to seek full-time employment while enrolled.
None of this means that today’s graduates face no challenges. Wage growth, housing costs, credential inflation, and changing employer expectations are real concerns. But the unemployment data do not support the claim that young workers are experiencing historically unprecedented difficulty finding work.
The real story is not that young workers suddenly face an unprecedented labor market. Youth unemployment isn’t a sign that the labor market is broken. It’s a reminder that entering the labor market has always been harder than being established in it.
=======================
Here are the relevant links
Youth unemployment, ages 16–24 (series LNS14024887): https://fred.stlouisfed.org/series/LNS14024887
Prime-age unemployment, ages 25–54 (series LNS14000060): https://fred.stlouisfed.org/series/LNS14000060
Labor force participation, ages 20–24 (series LNS11300036): https://fred.stlouisfed.org/series/LNS11300036
College enrollment stats: Full historical table (1970–2017), NCES Digest Table 302.60:https://nces.ed.gov/programs/digest/d18/tables/dt18_302.60.asp — direct Excel download: https://nces.ed.gov/programs/digest/d18/tables/xls/tabn302.60.xls
College enrollment stats: Current figures + methodology (NCES Condition of Education, “College Enrollment Rates”):https://nces.ed.gov/programs/coe/indicator/cpb/college-enrollment-rate
Photo by Alpha Perspective on Unsplash